Creating the right energy mix for small communities

Representatives of smaller communities are overwhelmed by a huge amount of information regarding emerging energy technologies, which tends to exacerbate existing uncertainty. A new online tool from Fraunhofer is now helping to clarify this confusion, calculating the optimal energy mix for each individual case — including funding possibilities available.
The transition to a new energy economy is imminent. However, representatives of small communities are often unable to envision exactly what is the best solution for them due to missing resources and knowhow. Solar power, photovoltaics or geothermal? What is suitable for a community and what percentage could each technology contribute to the community’s energy needs? Are there any funding opportunities available?
Researchers of the Advanced System Technology Branch of the Fraunhofer Institute for Optronics, System Technologies and Image Exploitation IOSB-AST have developed a software tool which analyses the needs and opportunities for a specific community. The optimisation tool is one of the major outcomes of the project ‘Technological and Economic Energy Modeling — modTRAIL’.
“With our project, mayors of smaller communities can learn about technical possibilities available for the transition into a new energy economy and corresponding opportunities for funding — and the information they receive is tailored specifically to their community,” said Liane Rublack, a scientist at Fraunhofer IOBS-AST. “The tool uses a mixture of conventional and renewable energy sources to calculate the optimised solution for the heat and electricity generation of the community.”
In four model municipalities located in the German federal state of Thuringia with fewer than 10,000 inhabitants — namely Kahla, Werther, Neumark and Großobringen — the researchers are already testing the tool. First the decision-makers in the communities have to insert the name of their municipality, whereupon they receive details about the electricity and heating demand in their locality. Afterwards, they specify their preferences for future power and heating supply. What technologies would they like to use and which ones would they prefer to rule out? There are numerous options to choose from, including solar and wind power, battery and thermal storage units, condensing oil and gas boilers, air heat pumps and geothermal heat pumps.
The tool also elicits the decision-makers’ preferences regarding other factors. Is minimising CO2 the top priority? Or are the costs of purchasing the energy more important? Based on this prioritisation, the software tool determines the mixture of energy and power plants. For example, this might be a combination of photovoltaic plants, battery and thermal storage systems, and combined heat and power plants. The output also includes the costs for installation and operation, the energy procurement costs, the amount of CO2 emissions and the funding possibilities available.
“With our optimisation tool, we want to start the process and show the mayors of small communities the potential offered by renewable energy sources for their municipalities,” Rublack said.
The researchers used standard load profiles for households as well as the time series for renewable energy sources recorded by the German Meteorological Service — in this case, by the Thuringia weather station at Erfurt-Weimar — for their software tool. For communities in Thuringia with fewer than 10,000 inhabitants, the necessary data is already stored in the system. The tool can also be used in other German states with the corresponding data.
The developed optimisation model is an integral part of the online software of the ‘Transformation in Rural Areas’ (TRAIL) joint research project. The specific goal of the project is to motivate a large number of smaller communities to engage fully with the questions of efficient energy supply with the help of the easy-to-use optimisation tool. In particular, it lowers the barriers for the communities to start, which are due to limited human and financial resources.
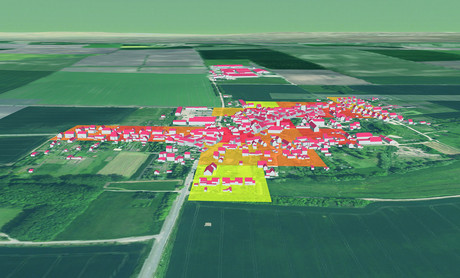
An online software tool was developed which generates initial statements about electricity and heating consumption of the community chiefly based on publicly available GIS data and census data and further existing databases. Furthermore, the optimisation part generates recommendations for the energy transition procedure of the specific community.
Partnership brings innovative fuel solutions to Gippsland
A study by European Energy Australia and Opal at the latter's Maryvale Paper Mill will assess...
Data centres — a missed opportunity for sustainability
The question is no longer whether we need data centres, but how we plan, locate and govern...
Sodium-ion battery may provide greener energy
Scientists say sodium-ion batteries may be the answer to the future of sustainable energy storage...


